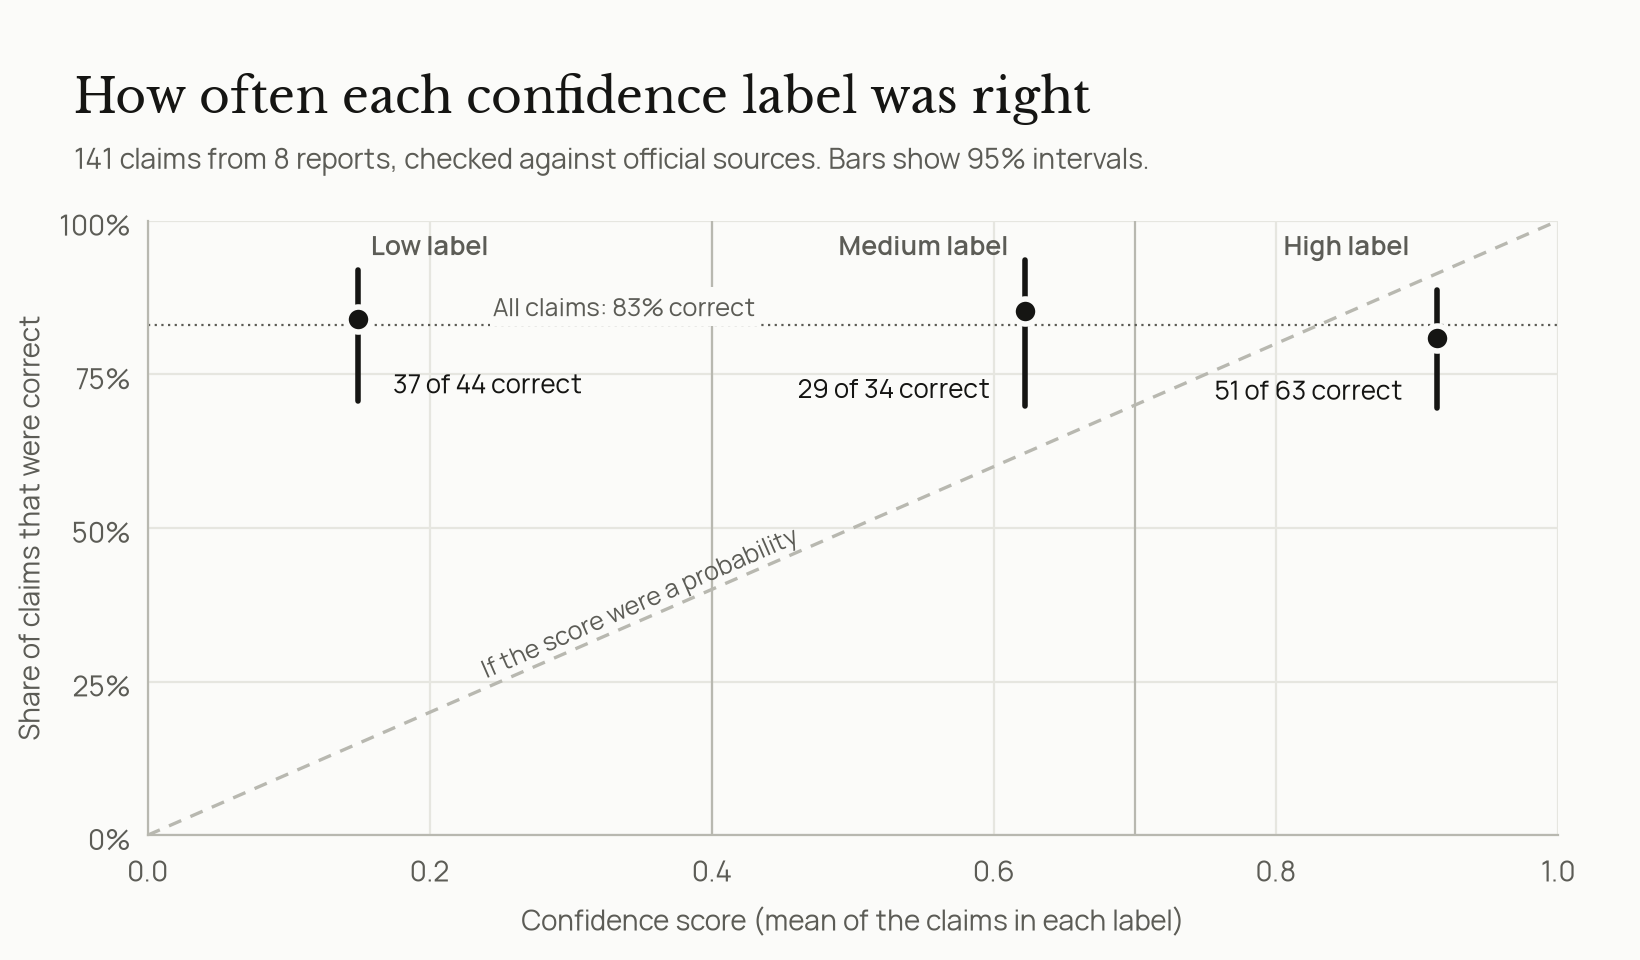
My research agent gives every claim in its reports a confidence label: high, medium or low. In the earlier post I wrote that this score measures the evidence and not the truth, and in this post I measure how well the evidence predicts the truth. I had 156 claims from eight reports checked against official sources, and the claims labeled low were right as often as the claims labeled high.
The picture above shows the result. If the score worked as a probability, the three points would sit on the diagonal, with low-confidence claims right less often than high-confidence ones. Instead they sit at about the same height, between 81% and 85% correct. Asking the model itself how likely each claim was to be correct worked better, although it still missed errors that need close reading of the law. The rest of this post explains how the labels are computed, how the claims were checked, why the score missed the wrong ones, how two other signals did, and what that means for which claims a person should check.
How the agent labels a claim
The agent's analyst step pulls claims out of the sources it found and says which sources support each claim. Code then computes a score from those sources, so the same sources always give the same score:
- Authority of the strongest source, from official EU legal text (1.0) and Commission pages (0.85) down to news and blogs (0.15).
- Recency of that source. Most sources have no date, and an undated source counts 0.8.
- Corroboration, which rises with the number of different websites that support the claim, from 1.0 for one site to 1.4 for three or more.
The score is authority × recency × corroboration, capped at 1.0, and the report shows it as a label: high from 0.7, medium from 0.4 and low below that. Nothing in this formula looks at whether the claim says the same thing as its sources. It describes the sources, and that is why I wanted to know how well it predicts correctness.
How the claims were checked
I took every scored claim from the September runs of two versions of the agent, four benchmark questions each, which gave 156 claims. Before checking any of them, I wrote down the rules in an analysis plan:
- Truth is judged as of the run date, against official sources only: the AI Act and its 2026 amendment on EUR-Lex, the Commission's AI Act pages, the NANDO database of notified bodies, and official US government pages for US policy.
- A claim is correct when an official source confirms all of it, and incorrect when an official source contradicts any part of it. A claim that is partly wrong counts as incorrect, because a reader cannot tell which part to trust.
- A claim is unverifiable when no official source settles it, for example "no enforcement actions so far" or an opinion. These claims are left out of the accuracy numbers.
- Every label records the official link and the sentence or article that decides it.
The claims were checked from a blind copy without the scores and without the sources the agent cited, because the source type sets most of the score. Claude (Opus 5.5) drafted each label with its evidence, and the same model then checked all 156 again, rule by rule, before any score was looked at. That second pass changed one label, because an Irish regulation had been amended in July 2026. A model checking its own work is not an independent check.
Of the 156 claims, 15 were unverifiable, which left 141 claims that could be scored as right or wrong.
How often each label was right
| Confidence label | Claims checked | Correct | Share correct | Mean score |
|---|---|---|---|---|
| High | 63 | 51 | 81% | 0.91 |
| Medium | 34 | 29 | 85% | 0.62 |
| Low | 44 | 37 | 84% | 0.15 |
The three labels were right about equally often, and the 95% intervals overlap almost completely (shown as bars in the figure at the top). Another way to say it is with the AUROC, the chance that a randomly chosen correct claim has a higher score than a randomly chosen wrong one. For the evidence score it is 0.47, where 0.5 means no better than chance, with an interval from 0.33 to 0.61.
Read as probabilities, the scores are also far off. Claims labeled low had a mean score of 0.15 but were right 84% of the time, so the score underrates them badly, while the high label slightly overrates its claims. The calibration error, the average gap between the mean score and the share correct in each label, is 0.32. With 141 claims these numbers are rough, but the gap is too large to be noise.
Why the score missed the wrong claims
Of the 24 wrong claims, 22 were partly right, and many of them cited pages of the EU institutions but changed a detail on the way into the claim:
- Two claims said the Annex III obligations applied "36 months after entry into force, i.e., 2 August 2026". The date is right, but it is 24 months after entry into force, and 36 months is the date for AI in regulated products.
- A claim said the European Parliament approved the 2026 amendment on 11 June 2026. The vote was on 16 June 2026, and the only "11 June" in what the agent saw was the web address of the Parliament's press release, which starts with 20260611.
- A claim said the obligations for general-purpose AI models took effect in August 2026. They took effect in August 2025, and it is the Commission's power to fine that started in August 2026.
Each of these claims scored 0.95, because a page of an EU institution backed it. The score asks who said something, and these errors happen in the step after that, when the analyst turns a good source into a sentence. Half of the wrong claims, 12 of 24, were labeled high.
Some of the labels were judgment calls, for example whether a slightly wrong count makes a claim wrong. To see whether those calls drive the result, I repeated the numbers without the 35 claims I had marked as judgment calls. This check was not in the plan, and I added it after seeing the first results. The pattern became clearer: all 8 claims that were clearly wrong had scores of 0.56 or more, and all 33 low-score claims that were not judgment calls were right.
Two other ways to measure confidence
I also tried two signals that are common for language models, both from the agent's own model, Claude Sonnet 5. For each claim, the model got the claim and its cited sources in the same format the analyst saw:
- Stated confidence: asked once for the probability, from 0 to 100, that the claim is correct.
- Agreement: asked five times, in separate calls, whether the sources fully support the claim. The signal is the share of yes answers.
The 936 calls cost $2.38.
| Signal | AUROC (95% interval) | Calibration error |
|---|---|---|
| Evidence score | 0.47 (0.33 to 0.61) | 0.32 |
| Model's stated confidence | 0.66 (0.54 to 0.78) | 0.08 |
| Agreement over five checks | 0.61 (0.52 to 0.71) | 0.15 |
The model's stated confidence was the best of the three. It ranked claims better than chance, and its AUROC was 0.20 higher than the evidence score's, with an interval from 0.04 to 0.35. Its numbers were also close to the truth for most claims, because the 122 claims it gave 70% or more averaged 93% and were right 87% of the time. It caught several errors that the evidence score rated high, for example the claim that America's AI Action Plan came out in July 2023, which it gave 3%, and the claim that the obligations for general-purpose AI models took effect in August 2026, which it gave 10%.
It missed the errors that need close reading of the law, and both "36 months" claims got 95% or more. It also doubted correct claims about events in 2026, such as the Council's final approval of the amendment on 29 June 2026, which it gave 10%. A likely reason is that these events are newer than what the model learned in training, so its confidence mixes the sources with what it already knew.
The agreement signal hardly varied. All five answers were yes for 142 of the 156 claims and no for 7, and they differed for only 7 claims. When the answers were mostly no, the claim was usually wrong, and of the 6 checked claims with at most one yes, 4 were wrong. This happened for too few claims to help a person choose among the rest.
What a person would have to check
The point of a confidence label is to decide which claims a person should check before relying on a report. So I asked what would happen if every claim below a cut-off went to a person:
| Rule | Claims a person checks | Wrong claims that still pass |
|---|---|---|
| Check nothing | 0% | 24 of 24 |
| Check every claim below 0.4 | 35% | 17 of 24 |
| Check every claim below 0.7 | 58% | 12 of 24 |
| Check everything | 100% | 0 of 24 |
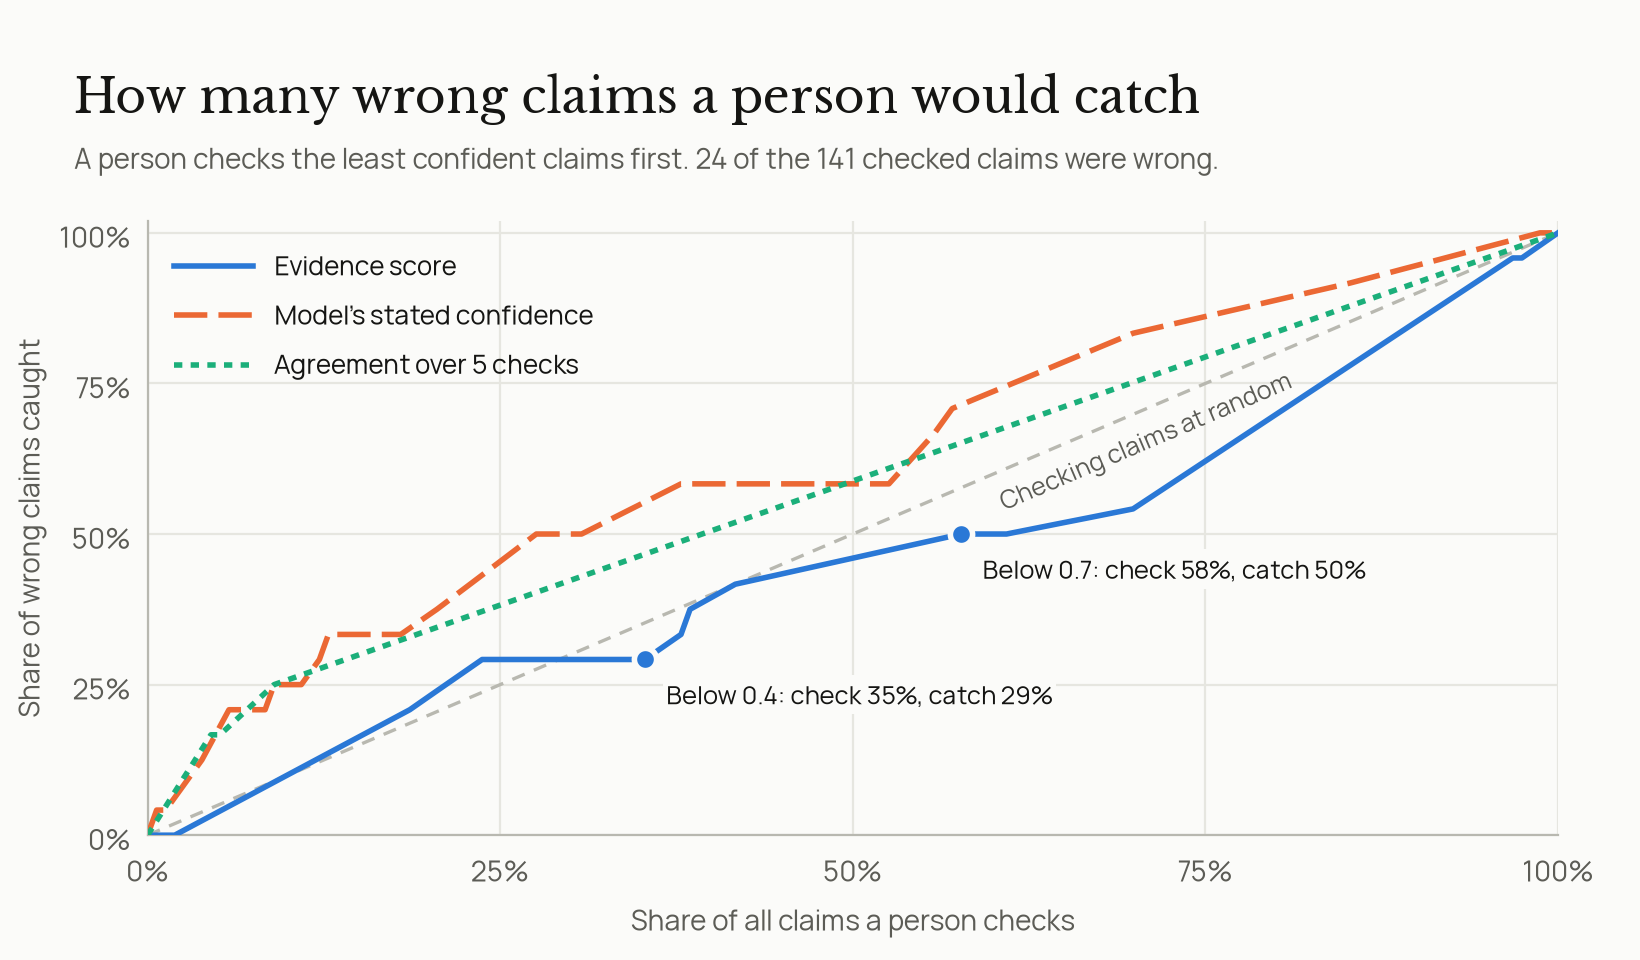
With the cut-off at 0.7, a person would check more than half of all claims and still miss half of the wrong ones. Checking the same number of claims at random would on average catch slightly more, because the score does not put the wrong claims first. Checking the same 58% of claims in order of the model's stated confidence would let about 7 of the 24 wrong claims pass instead of 12, and in order of agreement about 8.
Fixing the numbers does not fix the ranking
A common fix for a badly calibrated score is to learn a mapping from the score to the chance of being correct, for example with a logistic regression (Platt scaling). I fitted one with 5-fold cross-validation, so that every claim was predicted by a fit that never saw it. The calibration error fell to almost zero, but only because every claim got a prediction between 78% and 88%, close to the overall 83%. That is no better than a constant guess of 83% for every claim. A score can be made calibrated in this way, but if it cannot rank claims, it still cannot tell a person which claims to check.
What this does not show
- This is one agent's labels on 156 claims from eight reports on one topic. It says nothing general about the calibration of language models.
- Claims in the same report share sources, so they are not independent, and the intervals above are narrower than they should be.
- The labels were drafted and checked by an AI model, and a different checker could draw some lines differently.
- The rules are strict, because a wrong detail makes a claim wrong. The result held when I left out the judgment calls, but a more lenient rule would count fewer wrong claims.
- The 15 unverifiable claims are left out, and 11 of them had low scores.
What I would change
I did not change the scoring in this project, because the point was to measure the score as it is. The results suggest three changes:
- The evidence score should be shown as what it is, a description of the sources, and not as a confidence.
- The model's stated confidence was the most useful signal here, and it costs one short call per claim, so it is worth adding next to the evidence score.
- The agent needs a check of each claim against the text of the source it cites, the way the question-answering system I built on the same regulation checks every citation against the passages it retrieved, because the errors that both the score and the model missed happen when a source is turned into a claim.
The third change is the next thing to build, and to test the same way.
The claims, the labels with their evidence, the analysis code and the results are in the calibration folder of the agent's repository.